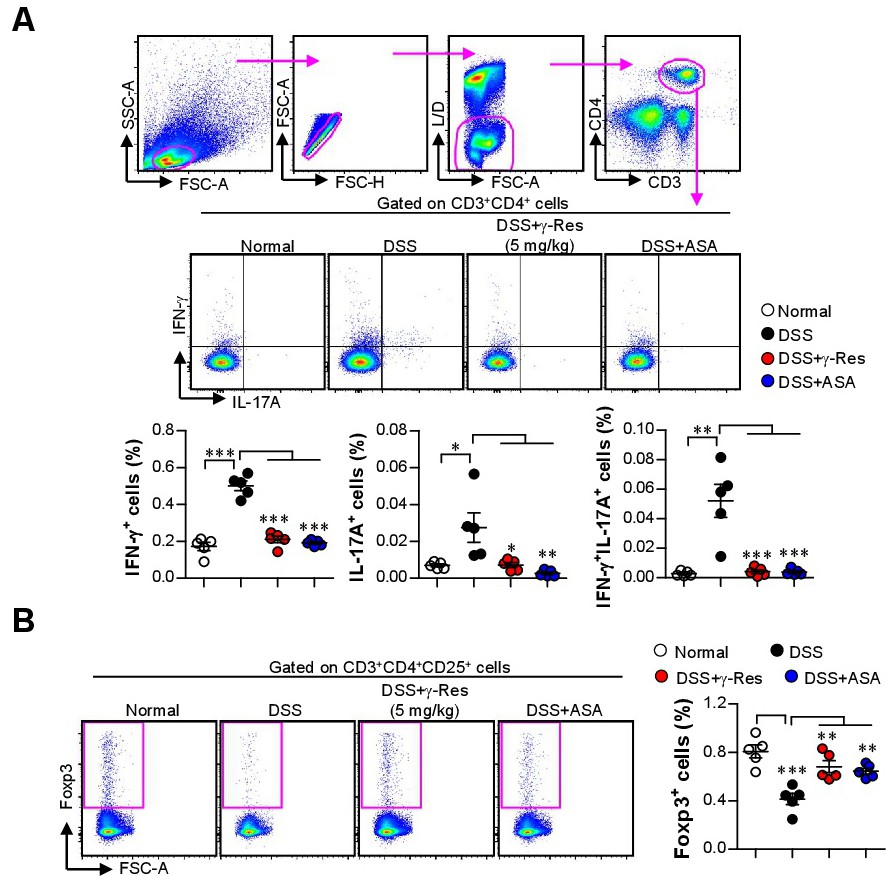
Fig. 12. Oral administration of γ-Res induced the reduction of Th1 and Th17 cells and the induction of regulatory T cells in DSS-induced colitis mice. A) Cells isolated from splenocytes of each group were stimulated with anti-CD3/CD38 Abs in the presence of GolgiPlug for 9 h, and then, the cells were stained LIVE/DEAD (L/D), anti-CD3, anti-CD4, anti-IFN-γ, anti-IL-17A Abs and analyzed by flow cytometry. Lymphocytes were then gated based on their characteristic patterns of forward scatter and side scatter, and dead cells were excluded by gating out cells with positive staining with the LIVE/DEAD viability dye (A; gating strategy). The graphs show the percentage of each of the CD3+CD4+IFN-γ+, CD3+CD4+IL-17A+, and CD3+CD4+IFN-γ+IL-17A+ T cells. B) Cells isolated from the splenocytes of each group were stimulated with anti-CD3/CD38 Abs for 18 h. The graphs show the percentage of CD3+CD4+CD25+Foxp3+ regulatory T cells. The values shown represent the mean ± SD (n = 5 mice of group). *p<0.05, **p<0.01, or ***p<0.001.